OKR Progress Tracking
Complete guide to tracking and monitoring OKR progress across departments, teams, and individuals with detailed analytics and insights
OKR Progress Tracking
Overview
OKR Progress Tracking provides comprehensive visibility into organizational performance across multiple dimensions. This powerful interface allows you to monitor, analyze, and optimize progress at the department, team, and individual levels, ensuring alignment and accountability throughout your organization.
Understanding Progress Tracking Views
The OKR Progress interface offers three distinct perspectives to help you understand performance patterns and identify opportunities for improvement:
- Department View: High-level departmental performance and resource allocation
- People View: Individual contributor progress and personal development tracking
- Team View: Team-level collaboration, objectives, and collective performance
Each view provides unique insights and actionable data to support decision-making and performance optimization.
Department Progress View
The Department view provides a macro-level perspective on organizational performance, showing how different departments are contributing to overall company success.
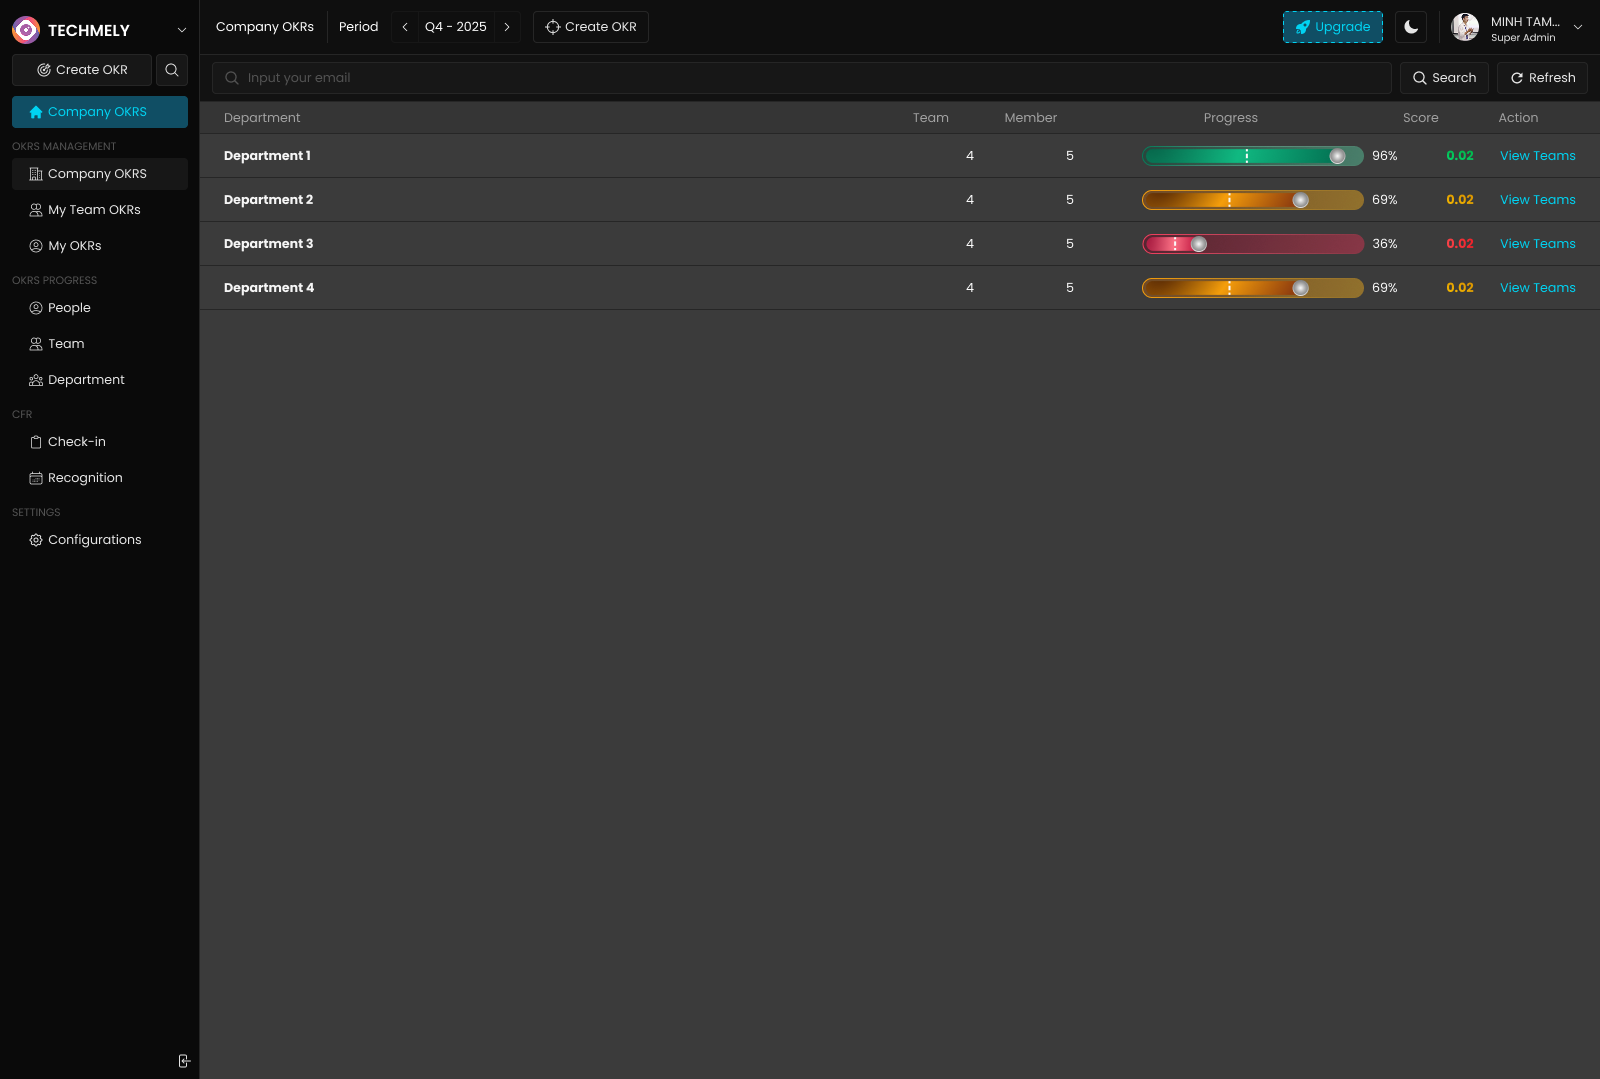
Department Interface Elements
Search and Filter Functionality:
- Search Bar: "Input your email" - Quick search for specific departments or users
- Search Button: Execute search queries
- Refresh Button: Update data with latest progress information
Department Performance Table:
- Department Name: Clear identification of organizational units
- Team Count: Number of teams within each department
- Member Count: Total employees in the department
- Progress Bar: Visual representation of overall department progress
- Score: Numerical performance indicator (0.00-1.00 scale)
- Action Button: "View Teams" - Access detailed team information
Department Progress Analysis
Sample Department Performance: Based on the interface, departments show varied performance levels:
- Department 1: 96% progress, 0.02 score (High completion, optimization needed)
- Department 2: 69% progress, 0.02 score (Moderate progress, attention required)
- Department 3: 36% progress, 0.02 score (Behind schedule, intervention needed)
- Department 4: 69% progress, 0.02 score (Moderate progress, monitoring required)
Key Metrics and Indicators
Progress Percentage:
- 90-100%: Excellent performance, meeting or exceeding targets
- 70-89%: Good progress, on track for quarterly goals
- 50-69%: Moderate progress, may require additional support
- Below 50%: Behind schedule, immediate attention needed
Team and Member Ratios:
- Team Distribution: Each department shows 4 teams, indicating balanced structure
- Member Count: Consistent 5 members per department suggests standardized team sizes
- Resource Allocation: Uniform distribution may indicate equal resource investment
Color-Coded Status Indicators:
- 🟢 Green (96%): Department 1 - Excellent performance
- 🟡 Orange (69%): Departments 2 & 4 - Moderate performance
- 🔴 Red (36%): Department 3 - Requires immediate attention
People Progress View
The People view focuses on individual contributors, providing detailed insights into personal performance, engagement, and development progress.
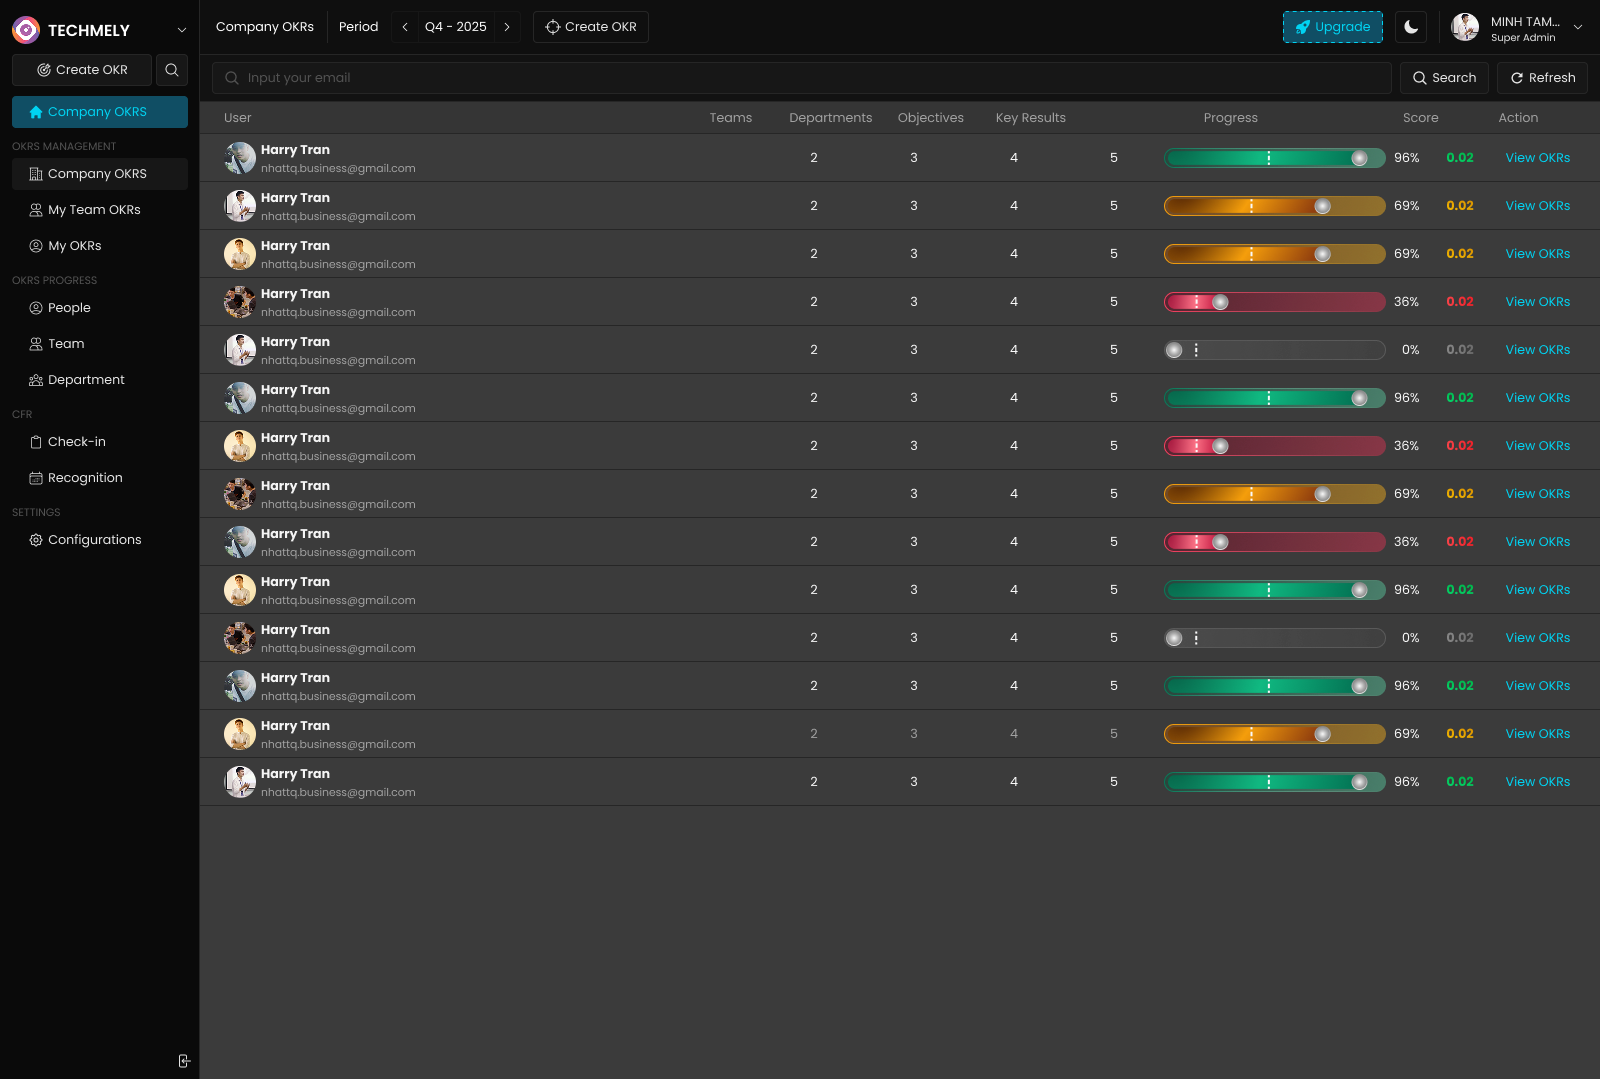
Individual Performance Interface
User Information Display:
- Profile Pictures: Visual identification of team members
- Name and Email: Complete contact and identification information
- Teams Count: Number of teams each person participates in
- Departments Count: Cross-departmental involvement tracking
- Objectives Count: Number of personal objectives assigned
- Key Results Count: Total key results responsibility
Performance Metrics:
- Progress Bar: Individual completion percentage
- Score: Personal performance indicator
- Action Button: "View OKRs" - Access individual objective details
Individual Performance Analysis
Sample Performance Data: Multiple Harry Tran entries show consistent patterns:
- Team Participation: Each person involved in 2 teams
- Department Involvement: 3 departments per person (cross-functional roles)
- Objective Load: 4 objectives per individual
- Key Results: 5 key results per person
Performance Distribution:
- 96% Progress: High performers (Green status)
- 69% Progress: Good performers (Orange status)
- 36% Progress: Underperforming individuals (Red status)
- 0% Progress: Not started or blocked (Gray status)
People Management Insights
Workload Assessment:
- Objective Balance: Consistent 4 objectives per person indicates standardized expectations
- Cross-Functional Engagement: 2-3 team/department involvement shows collaborative structure
- Key Result Distribution: 5 key results per person suggests detailed measurement approach
Performance Patterns:
- High Performers: 96% completion rate with strong execution
- Standard Performers: 69% completion, meeting most expectations
- Development Needed: 36% completion, requiring support and intervention
- Non-Starters: 0% completion, need immediate engagement and assistance
Team Progress View
The Team view provides insights into collective team performance, leadership effectiveness, and collaborative outcomes.
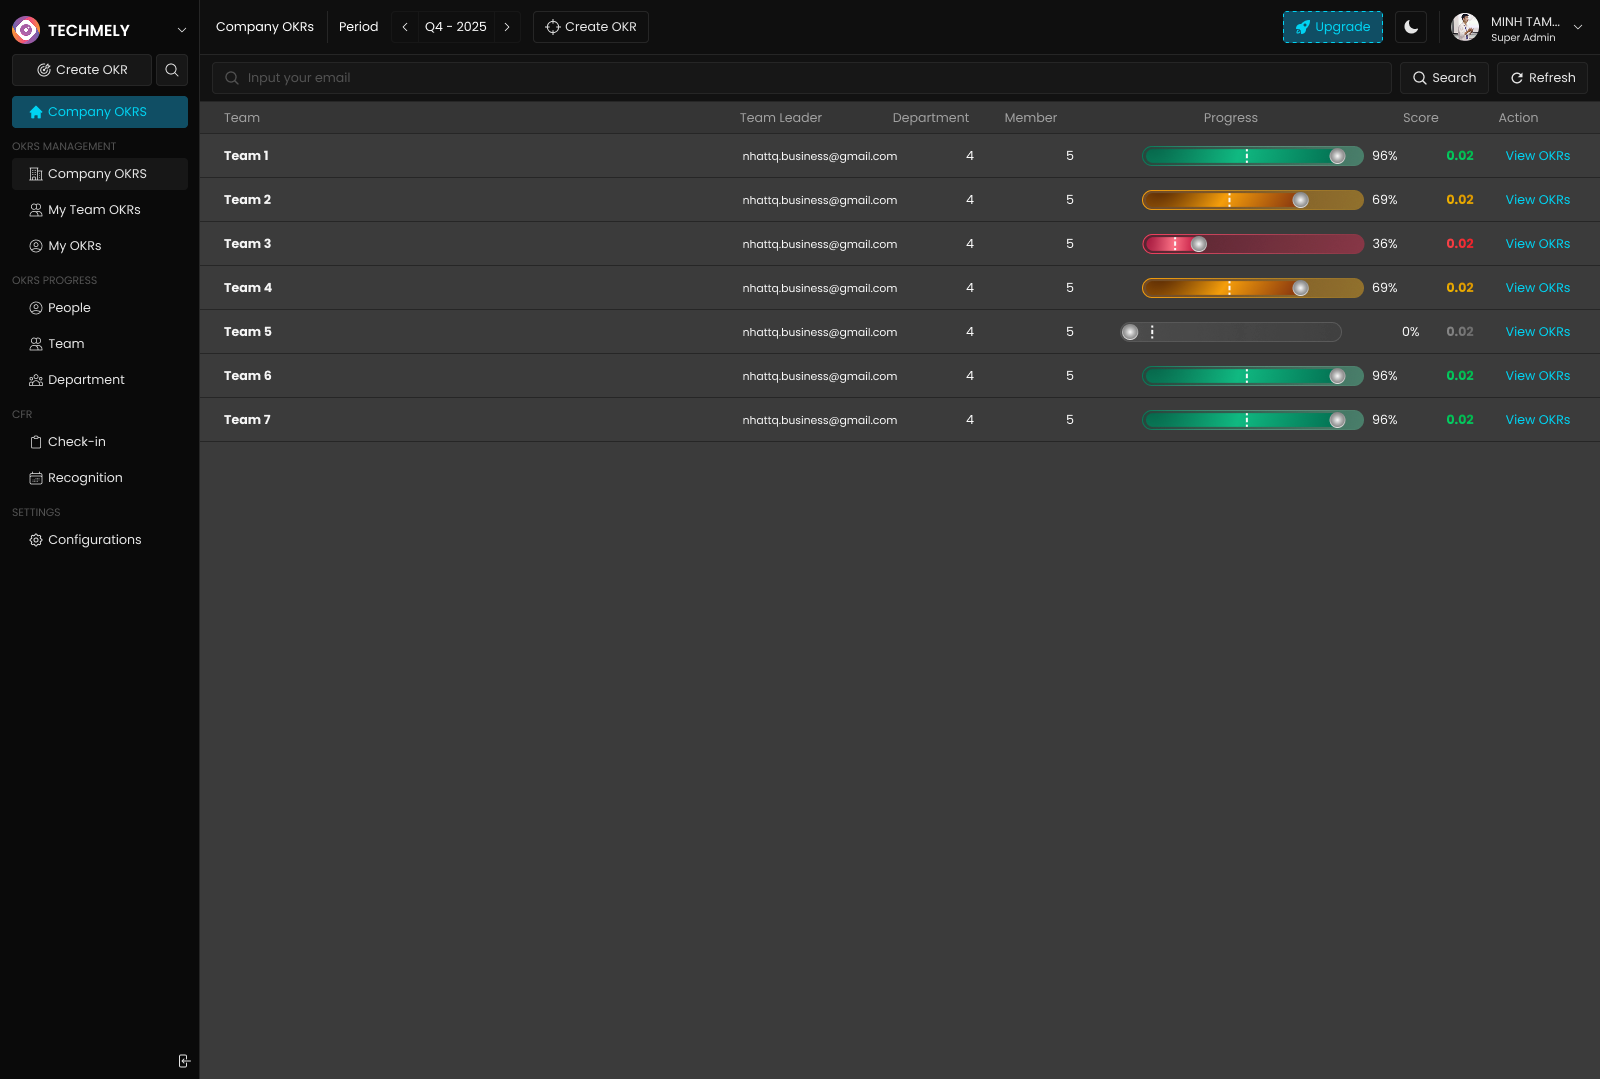
Team Structure Interface
Team Organization Display:
- Team Name: Clear team identification (Team 1, Team 2, etc.)
- Team Leader: Responsible leadership contact information
- Department: Organizational unit affiliation
- Member Count: Team size and composition
- Progress Visualization: Team-level completion status
- Score: Collective performance indicator
Team Performance Metrics:
- Leadership Accountability: Each team has designated leader contact
- Consistent Structure: Teams show uniform 4-5 member composition
- Department Alignment: Clear departmental association for each team
- Performance Variance: Different completion rates across teams
Team Performance Analysis
Sample Team Data:
- Team 1: 96% progress, 0.02 score (Excellent performance)
- Team 2: 69% progress, 0.02 score (Good performance)
- Team 3: 36% progress, 0.02 score (Needs improvement)
- Team 4: 69% progress, 0.02 score (Steady performance)
- Team 5: 0% progress, 0.02 score (Not started/blocked)
- Team 6: 96% progress, 0.02 score (High achievement)
- Team 7: 96% progress, 0.02 score (Consistent excellence)
Team Leadership and Structure
Leadership Consistency:
- All teams show "nhattq.business@gmail.com" as team leader
- Consistent leadership contact suggests centralized coordination
- Clear accountability structure with designated leaders
Team Composition:
- Standard Size: Most teams have 4 members with some having 5
- Resource Balance: Relatively uniform team sizing
- Scalability: Consistent structure supports organizational growth
Progress Tracking Terminology
Performance Indicators
Progress Percentage:
- Calculation: (Current Achievement / Target Goal) × 100
- Real-time Updates: Automatically calculated from key result progress
- Weighted Average: Considers importance of different objectives
- Trend Analysis: Shows improvement or decline patterns over time
Score Metrics:
- 0.00-0.30: Poor performance requiring immediate intervention
- 0.31-0.60: Below expectations, needs support and improvement
- 0.61-0.80: Meeting expectations, steady performance
- 0.81-1.00: Exceeding expectations, excellent performance
Status Color Coding:
- 🟢 Green: On track or ahead of schedule
- 🟡 Orange: Behind but recoverable with effort
- 🔴 Red: Significantly behind, requires immediate action
- ⚫ Gray: Not started or insufficient data
Organizational Metrics
Team and Department Counts:
- Team Distribution: Number of teams within departments
- Member Allocation: Individual assignments across teams
- Cross-Functional Participation: Multi-team involvement tracking
- Resource Utilization: Efficiency of human resource deployment
Objective and Key Result Tracking:
- Objective Load: Number of high-level goals per entity
- Key Result Density: Specific measurable outcomes per objective
- Completion Ratios: Achievement rates across different levels
- Alignment Verification: Connection between individual and organizational goals
Advanced Progress Analysis
Performance Benchmarking
Comparative Analysis:
- Department Comparison: Relative performance across organizational units
- Team Benchmarking: Best practices identification from high-performing teams
- Individual Assessment: Personal development and performance trends
- Historical Tracking: Progress patterns over multiple quarters
Trend Identification:
- Improvement Trajectories: Teams and individuals showing consistent growth
- Risk Patterns: Early warning signs of performance decline
- Success Factors: Common characteristics of high-performing units
- Challenge Areas: Consistent underperformance indicators
Resource Optimization
Capacity Planning:
- Workload Distribution: Balanced assignment of objectives and key results
- Team Sizing: Optimal member counts for different types of objectives
- Cross-Functional Coordination: Efficient collaboration across departments
- Leadership Development: Succession planning and leadership effectiveness
Performance Improvement:
- Support Allocation: Targeted assistance for underperforming units
- Best Practice Sharing: Knowledge transfer from high performers
- Training Needs: Skill development requirements identification
- Process Optimization: Workflow improvements for better outcomes
Using Progress Data for Decision Making
Strategic Planning
Resource Allocation:
- High Performers: Additional challenges and stretch goals
- Moderate Performers: Continued support and development
- Underperformers: Intensive coaching and resource investment
- Non-Starters: Immediate intervention and problem-solving
Organizational Development:
- Team Restructuring: Optimizing team composition based on performance
- Leadership Changes: Addressing leadership effectiveness issues
- Process Improvements: Streamlining workflows for better outcomes
- Culture Enhancement: Building high-performance organizational culture
Performance Management
Individual Development:
- Career Planning: Growth opportunities based on performance trends
- Skill Building: Training programs targeted to performance gaps
- Recognition Programs: Celebrating high achievers and improvements
- Support Systems: Assistance for struggling performers
Team Optimization:
- Collaboration Enhancement: Improving team dynamics and coordination
- Goal Alignment: Ensuring team objectives support departmental goals
- Communication Improvement: Better information flow and transparency
- Accountability Systems: Clear responsibility and ownership structures
Best Practices for Progress Tracking
Regular Monitoring
Daily Reviews:
- Quick Status Checks: Brief progress indicator reviews
- Blocker Identification: Early problem detection and resolution
- Communication Needs: Information sharing and coordination
- Priority Adjustments: Adapting to changing circumstances
Weekly Analysis:
- Comprehensive Progress Review: Detailed performance assessment
- Trend Analysis: Pattern identification and projection
- Resource Requirements: Support and assistance needs
- Strategic Alignment: Connection to organizational objectives
Monthly Evaluation:
- Performance Benchmarking: Comparative analysis and best practices
- Goal Adjustment: Realistic target setting and modification
- Development Planning: Individual and team growth strategies
- Strategic Refinement: Organizational objective optimization
Data-Driven Insights
Analytics Utilization:
- Pattern Recognition: Identifying trends and correlations
- Predictive Modeling: Forecasting future performance
- Root Cause Analysis: Understanding performance drivers
- Solution Development: Evidence-based improvement strategies
Reporting and Communication:
- Stakeholder Updates: Regular progress communication
- Transparency Maintenance: Open and honest performance sharing
- Success Celebration: Recognition of achievements and milestones
- Learning Documentation: Capturing insights for future improvement
Troubleshooting Progress Issues
Common Performance Problems
Low Progress Rates:
- Resource Constraints: Insufficient tools, time, or support
- Unclear Objectives: Ambiguous or confusing goal definitions
- Skill Gaps: Missing capabilities or knowledge
- Motivation Issues: Engagement and commitment challenges
Inconsistent Performance:
- Process Variability: Lack of standardized approaches
- Communication Gaps: Poor information flow and coordination
- Priority Conflicts: Competing demands and resource allocation
- Leadership Inconsistency: Variable management effectiveness
Resolution Strategies
Performance Improvement:
- Root Cause Investigation: Deep dive into underlying issues
- Resource Provision: Additional support and tool access
- Training and Development: Skill building and capability enhancement
- Process Standardization: Consistent approaches and methodologies
System Optimization:
- Data Accuracy: Ensuring reliable and current information
- Interface Improvement: Better user experience and accessibility
- Integration Enhancement: Seamless workflow and system connectivity
- Feedback Mechanisms: Continuous improvement and adaptation
Next Steps
After understanding OKR Progress Tracking:
- Establish Monitoring Routines: Create regular review and analysis schedules
- Develop Action Plans: Address identified performance gaps and opportunities
- Implement Improvements: Execute optimization strategies and solutions
- Monitor Results: Track effectiveness of implemented changes
- Continuous Refinement: Ongoing optimization and enhancement
Related Topics
- OKR Management Overview - Complete management interface guide
- View OKR Details - Individual objective deep dives
- Key Result Details - Detailed outcome tracking
- Manage OKR Actions - Editing and updating objectives
OKR Progress Tracking is essential for maintaining organizational alignment and driving continuous improvement. By mastering these views and analytics, you can ensure your organization stays focused on what matters most and achieves exceptional results.
Suggested Related Articles
Create Account
Step-by-step guide to create your user account
Create Company-Level OKR
Complete guide to creating company-level Objectives and Key Results in AntOKR
Key Result Actions
Complete guide to managing key result actions including updating progress, editing details, changing ownership, and deleting key results
Change OKR Owner
Complete guide to changing ownership of OKRs across different levels with proper permissions and best practices
View OKR Details
Complete guide to viewing and understanding OKR details across all levels - Company, Team, and Personal
Create Company
Learn how to set up your company profile in AntOKR with step-by-step instructions